To release the potential for cycling and deliver the aspirations of both Government and WSCC policy we need “proper network planning” in the same way that we do for other modes of transport: bus routes are not “routes for bussists”, they are part of a network for people who happen to be using that mode of transport. In a similar way we should be thinking of “routes for cycling”. In the UK, cycle routes have tended to be opportunistic, e.g. the Centurion Way.

Mark Strong (l) talks to Louise Goldsmith (c) and Rosmary French (r
Cycling is currently mentioned in a range of spatial planning documents: local plans, local transport plans, neighbourhood plans, cycle strategies and – in future – LCWIPs, but these are often just ‘lines on a map’ without any supporting evidence. If challenged by a Planning Inspector, this lack of evidence means they can’t be implemented or supported against local opposition.
“Evidence supports the need for cycle network planning. To release the potential for cycling you have to plan for it.”
We have LTN2/08 but its hierarchy of provision is “trite” – it basically says, do the easy things first and if it’s hard, don’t bother.
The London Cycling Design Standards (LCDS) on the other hand has underpinned the recent improvements in cycling in the capital.

LCDS: The UK’s de-facto design guidance
It is based on international evidence and includes a 5-step network planning process:
Step 1: Review existing conditions
LAs frequently lack a reliable asset database for cycling – this is increasingly an issue as LA highways management plans are now based on an asset management approach.
The review process includes looking at main/minor roads, off-road cycle routes, barriers such as railway lines and key destinations. You will need to have, at the very least, a rough assessment of route quality.
Step 2: Route density
Start off with the aim of a network where no one is more than 400m from a cycle route (250m is the norm in the Netherlands). Mark showed how the actual levels of cycling correlate with route density, e.g. Harrow has 0.5% cycling and has poor route density, however Hackney with 6-15% cycling has a much denser network.
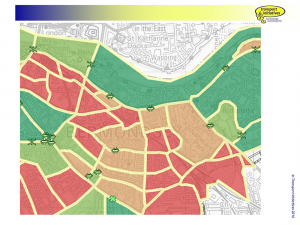
Step 3: Accessibility classification
Routes are classified as red, amber or green according to whether they are only suitable for ‘hardened adult cyclists’ or can be safely used by all. It is important to classify according to the worst case, i.e. during rush hour traffic.
Step 4: Area Porosity
He used the award-winning Southwark strategy as an example to look at ‘islands’ of easy-to-cycle roads and how many gateways there are linking them, i.e. how many links there are out of a zone against being “locked in” the zone.
Southwark: Area porosity and gateways
In Southwark, they are using this information to develop a package of measures aimed at improving these gateways and can also map how these measures will improve cycleability if implemented: “If you have to get off and walk, it defeats the purpose of cycling.”
Step 5: Cycling Level of Service (CLoS)
This is an objective tool that measures how good a cycle lane or route is. There are six criteria: safety (actual, perceived & social), directness, comfort, coherence, attractiveness and adaptability.
The tool can be used for an existing route or it can be used to see what a new route will be like when complete.
Factors can be “weighted” according to how important they are, each is scored out of 3 and then totaled up to give a final score – but if the scheme scores a critical on any one factor it should not be built.
UK routes typically score 30-40% which “may be suitable for some existing people riding cycles” but won’t attract new people to use them. By comparison, Danish routes typically score 70% and Dutch routes 98%. The threshold for a “decent” route is around 60-70%.
The completed network will be a combination of filtered permeability on quieter roads and main road treatments.
In conclusion, Mark stressed that to build a good quality cycle network you need a methodical process, buy-in from all partners, a good record of your assets and a high quality design which draws from a range of options.
See Mark’s presentation.
Return to the report.